Juho Ylä-Jääski

Links
Fitting and Visualization of a Regression Model
Project Description: This project was completed as a part of the course CS-C2120 - Ohjelmointistudio 2, and the project concentrated on the visualization of three types of regression models: linear, exponential, and logarithmic.
The primary motivation of the project was to create a program where the user of the program can visualize the trends of different data sets. The user first imports data sets, consisting of data points, into the program. These data sets are two-dimensional, meaning that each of the data points contains two variables (x, y). The user can then visualize these data sets with a plotting tool that enables the user to view the data points with the regression curve. The plotting tool also provides some additional features to modify the plot.
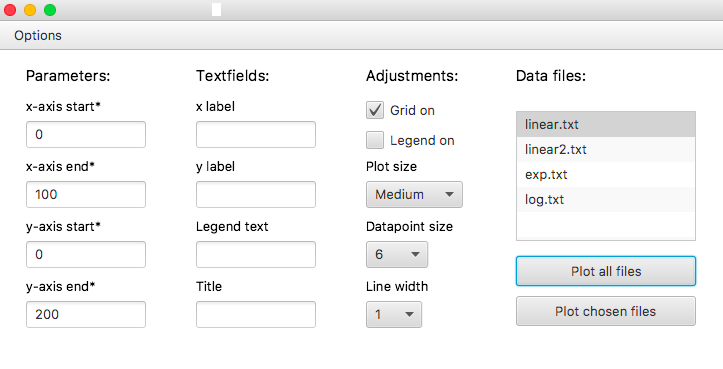
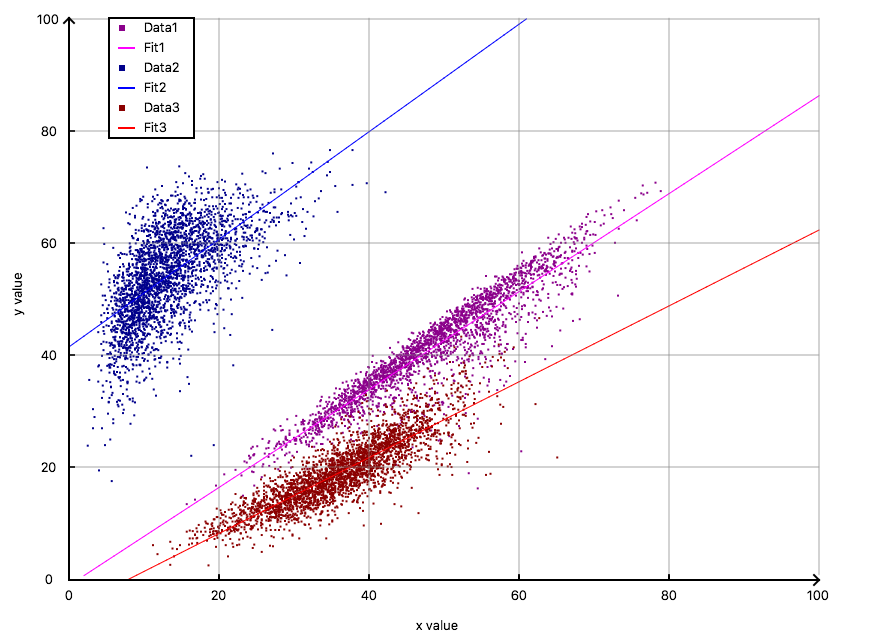
Results: The motivation of this project was to create a visualization tool for data sets and regression models. This program supports three types of regression models: linear, exponential, and logarithmic. Data sets, consisting of two-dimensional data points, can be easily imported, and analyzing the data sets together with the constructed regression models is enjoyable with the plotting tool where numerous modifications for the plot are supported, including zooming in and out. The final program is an easy tool to create plots together with regression models, and precise data analysis is also possible. The user interface and one example plot are presented below.